
Press & media resources
MyRiskMeter is a consumer health-outlook app — a weather report for disease. It turns public surveillance data into a plain-language daily read on what’s circulating where you live, plus a personalized risk score based on your own health context.
The Observatory is its free public face: a weekly, state-by-state view of U.S. disease activity built from CDC NWSS wastewater sampling, CDC NNDSS case reporting, and verified outbreak news signals — no login, no paywall.
What makes it novel is granularity: MyRiskMeter forecasts at the individual wastewater-treatment-plant level rather than the state aggregate. In internal validation, plant-grain signals correlated with subsequent reported activity at r = 0.564 at a 9-day lag — roughly a week and a half of early warning ahead of case-based reporting.
Statistics
U.S. states and territories with tracked disease activity.
CDC NWSS · CDC NNDSS
Pathogens followed across the surveillance network.
CDC NNDSS · verified reporting
Active wastewater sampling sites feeding the forecasts.
CDC NWSS
These numbers are read live from the surveillance database each time this page loads, so they stay current without manual updates. Sources: CDC NWSS, CDC NNDSS, verified outbreak reporting.
Media inquiries
Interviews, data questions, and fact-checking: press@myriskmeter.app
We can usually turn around a data pull, a state-specific chart, or a methodology explainer the same day. If you’re on deadline, say so in the subject line.
Downloads
Logos & app icon
MyRiskMeter logoPNG · transparent backgroundApp iconPNG · 1024 × 1024Social cardPNG · 1200 × 630

Need SVG or a dark-background variant? Email press@myriskmeter.app and we’ll send them over.
Observatory screenshots
National viewPNG · summary cards + US mapInteractive US mapPNG · state-level activity choropleth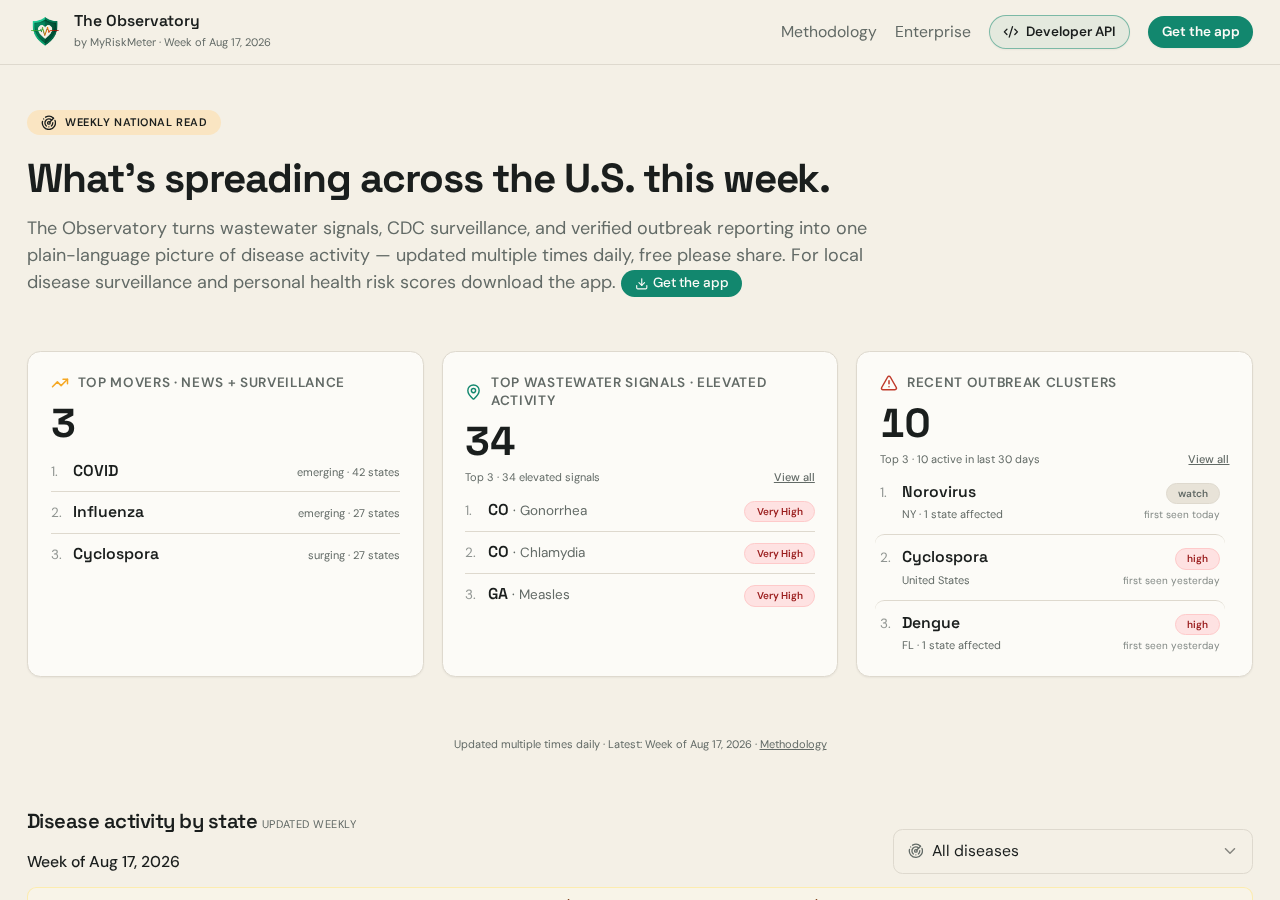

Screenshots are free to reproduce with credit to MyRiskMeter.
Methodology & background
Methodology preprint (ResearchSquare)Plant-grain wastewater forecasting and validationA plain-language walkthrough of how scores are built lives at /methodology. Download our press & media kit for a concise overview with quotable stats, data sources, and contact info:
MyRiskMeter Press & Media KitPDF · 2 pagesUsing our data
The Observatory API is free for editorial use — no key, no rate-limit negotiation for normal reporting volumes. Endpoints, parameters, and example responses are documented at /developers.
MyRiskMeter Disease Observatory, accessed September 24, 2026, www.myriskmeter.app/observatory
Replace the date with your access date. If you publish a chart built on our data, a visible “Data: MyRiskMeter” credit is enough.
One caveat we’d ask you to carry: this is aggregated surveillance data for informational purposes, not a clinical or diagnostic tool. Underlying sources can lag or be revised.
Recent updates & releases
Notable milestones
- Methodology preprint published — real-time plant-grain wastewater forecasting validated at r = 0.564 at 9-day lag; ResearchSquare, DOI 10.21203/rs.3.rs-9826576/v1
- Observatory v2 launched — CDC-first state synthesis, public API, state-level activity map at /observatory
- Personal Hazards feature — daily environmental risk surfacing (AQI, pollen, UV, wildfire smoke, heat) with condition-aware personalization
- Push notification infrastructure — APNs-based wave alerts for iOS users tracking respiratory disease surges in their state
- Splash email capture + weekly digest — free public subscription for state-level surveillance updates, no app install required
- Search discovery infrastructure — pre-rendered public pages so Observatory data surfaces in search results and social share previews
Version history
| Version | Released | Highlights |
|---|---|---|
| 1.0.5 | — | Score computation stability, location tracking accuracy on the road, plant-grain forecast honesty via CDC plant tiers, plan-outbreak alert deduplication |
| 1.0.4 | — | Wave-alert email framing update to state-signal language, wave-predict engine safeguards, smoothed-trend fallback on Disease Trends card |
| 1.0.3 | — | Observatory v2 with CDC-first synthesis, trend vocabulary news net, sparkline improvements |
| 1.0.2 | — | Outdoor venue flag, Sports Event venue type, food-handling permanent Today action, gym copy refinement, insurance card cleanup |
| 1.0.1 | — | Initial post-launch stability, disease tray additions (E. coli, Listeria, Lyme, Ebola, Marburg, Meningococcal, Zika), news outbreak detection |
Platforms
MyRiskMeter is available on the App Store for iPhone and iPad. An Android version is in closed beta and available upon request — email press@myriskmeter.app to be added to the beta distribution list.
MyRiskMeter aggregates public health data for informational purposes only. Not medical advice. Data may lag or contain errors. See our Terms of Service, Medical Disclaimer, and Privacy Policy.